jump to...
Using Fiddler with Azure Load Testing
A couple of days ago, I needed to test the scalability of a system by simply hitting it through its REST APIs and observing how it scales in the backend. It looked like an excellent opportunity to give Azure Load Test a shot :) Unfortunately, Azure Load Test supports only Apache JMeter scripts. That’s perfect if you already use JMeter, but not me. Not only do I not have experience with JMeter, but I’m also not willing to install Java to test JMeter. Not sure if Java still randomly pops up its update dialog, but my memories of it crafted a decent barrier for a Java install on my machine.
This is where I wondered if there was something else I could do. I wanted to put a single API under stress, nothing more. It looks like there is a path from Fiddler to Azure Load Test with a couple of stops on the way.
Getting to Our JMeter File
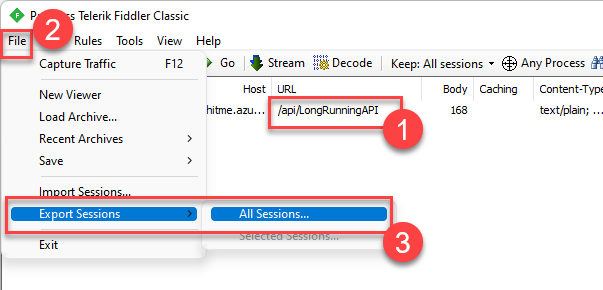
First, you have to run all the steps in Fiddler in a single Fiddler session. Ensure you have “File > Capture Traffic” disabled and have a clean session. In my case, I used the Composer window to send a simple HTTP request to the backend (1). It is all I wanted to replicate in the Azure Load Test environment. Next, select File (2) and Export Sessions > All Sessions (3).
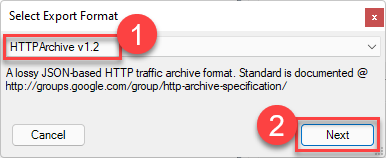
In the export dialog select HTTPArchive v1.2 (1) and hit Next (2). This will let you save a HAR file that includes all the requests in your session.
The HAR file we get as a result is actually a common file format supported by various vendors. You can export one from Chrome Dev Tools or Edge as well.
The next step is to convert the HAR file to JMX (JMeter) file. The easiest way to get it done is to upload your file to BlazeMeter’s online converter. Looking for a local option har2JMeter can be a nice alternative. Personally, I did not test it as it requires a Java install (hence my argument at the beginning of my post).
<ThreadGroup guiclass="ThreadGroupGui" testclass="ThreadGroup"
    testname="Thread Group" enabled="true">
    <stringProp name="ThreadGroup.on_sample_error">continue</stringProp>
    <elementProp name="ThreadGroup.main_controller"
        elementType="LoopController">
        <boolProp name="LoopController.continue_forever">true</boolProp>
        <stringProp name="LoopController.loops">1</stringProp>
    </elementProp>
    <intProp name="ThreadGroup.num_threads">200</intProp>
    <intProp name="ThreadGroup.ramp_time">1</intProp>
    <boolProp name="ThreadGroup.scheduler">false</boolProp>
    <longProp name="ThreadGroup.duration">0</longProp>
    <longProp name="ThreadGroup.delay">0</longProp>
</ThreadGroup>
Once you have the JMX file, you might want to open it up with a text editor to edit the XML to fine-tune some JMeter parameters. In my case, I have changed LoopController.loops value to 1 and set ThreadGroup.num_threads to 200. The official recommendation is to keep thread count under 250 for every Azure Load Test agent. When it comes to the endless loop, I will run this test manually, and I wanted to have it running till I stop it. If you are going to incorporate this test into a CI/CD pipeline, you don’t want a forever loop for sure.
Setting up Azure Load Test
Now it is time to set up our Azure Load Test service account in the Azure Portal. You can either search for Azure Load Test in the Portal or click here to go straight to the resource creation page. You will need to assign a new name to your service, and that’s pretty much it. Once you are on the Azure Load Test resource page, you will see a warning, though.
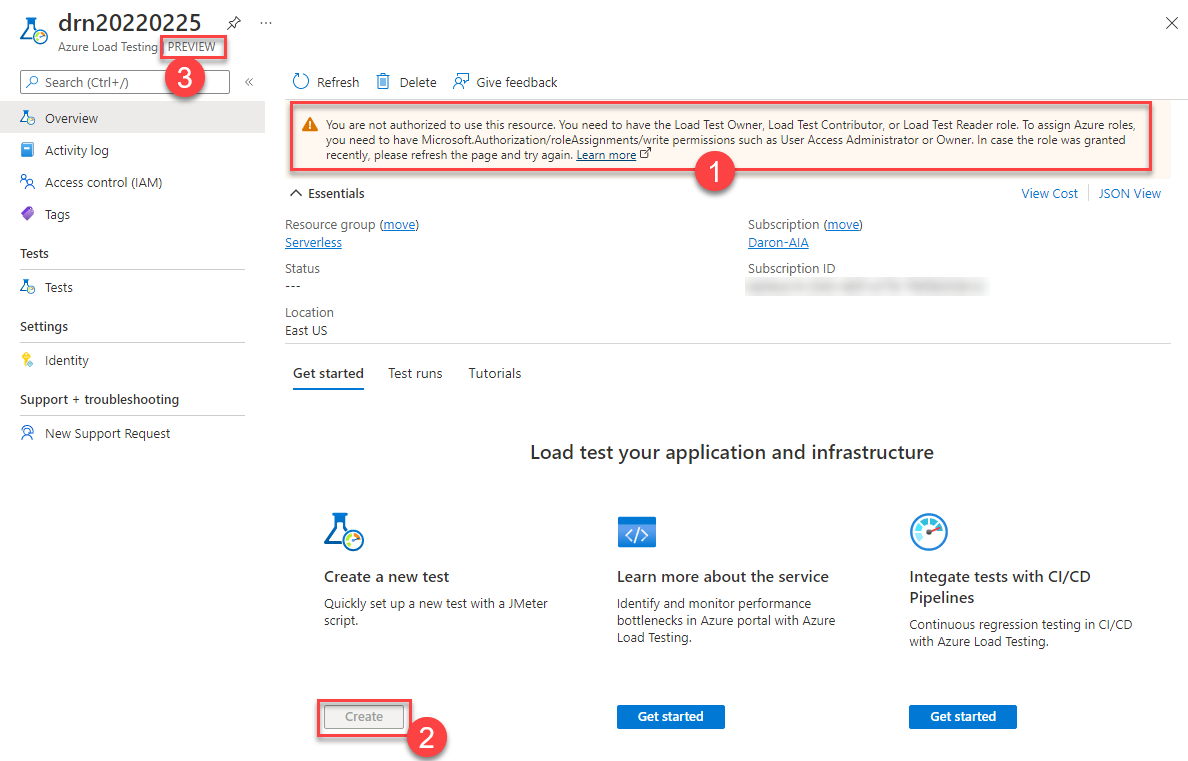
I’m assuming this warning (1) shows up because the service is in Preview (3). Otherwise, it does not make sense at all :) Right now, the service is telling us that we don’t have proper permissions to create a test (2). Let’s give ourselves the permissions.
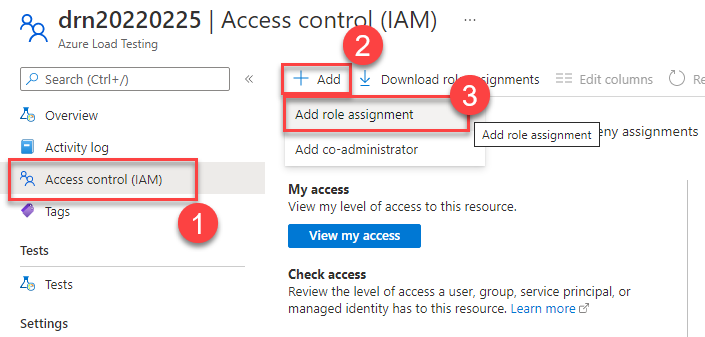
Switch to the Access Control (IAM) (1) panel. Select Add (2) > Add role assignment (3).
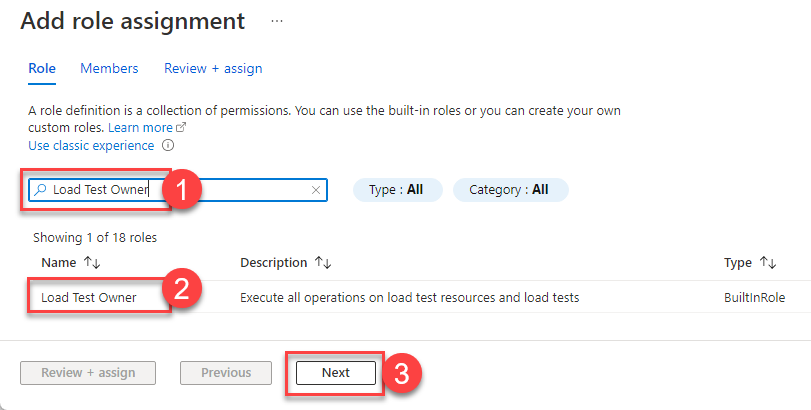
Search for Load Test Owner (1) role definition and select it (2). Select Next (3) to proceed.
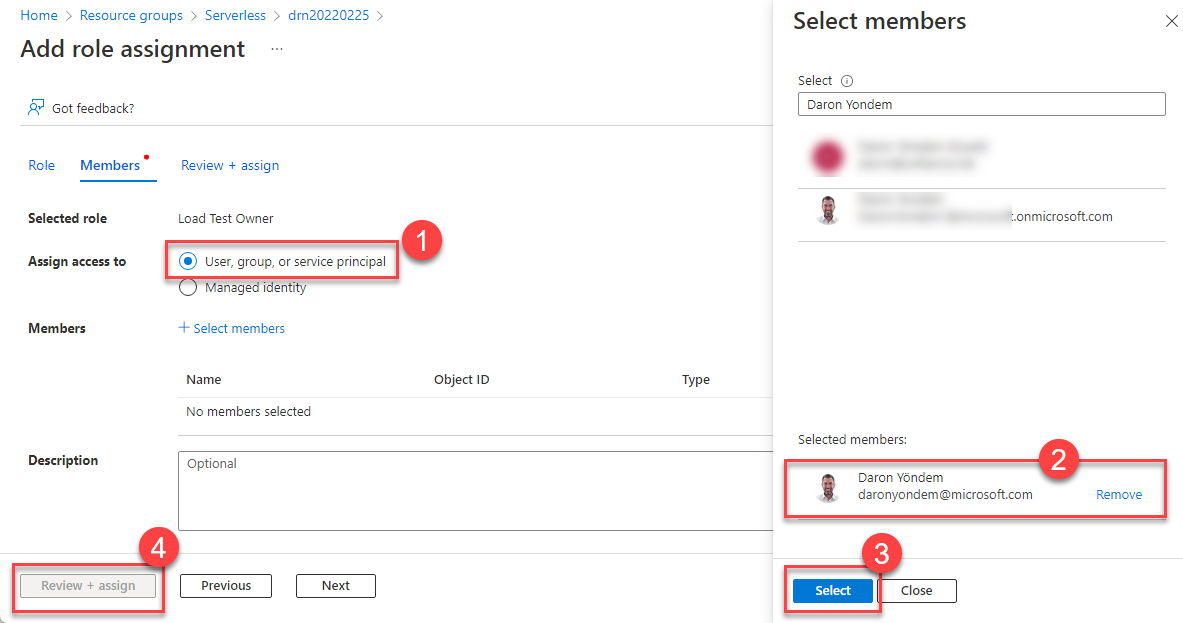
Select User, group, or service principal (1) and pick your user from the list of members (2). Finally, select Review + Assign (4) to get the correct permissions.
Creating Your First Test
Back to the Overview (1) page, you will see that the Create (2) button for tests is now enabled. If not, give your browser a nice refresh :) Select Create (2) and give your test a name.
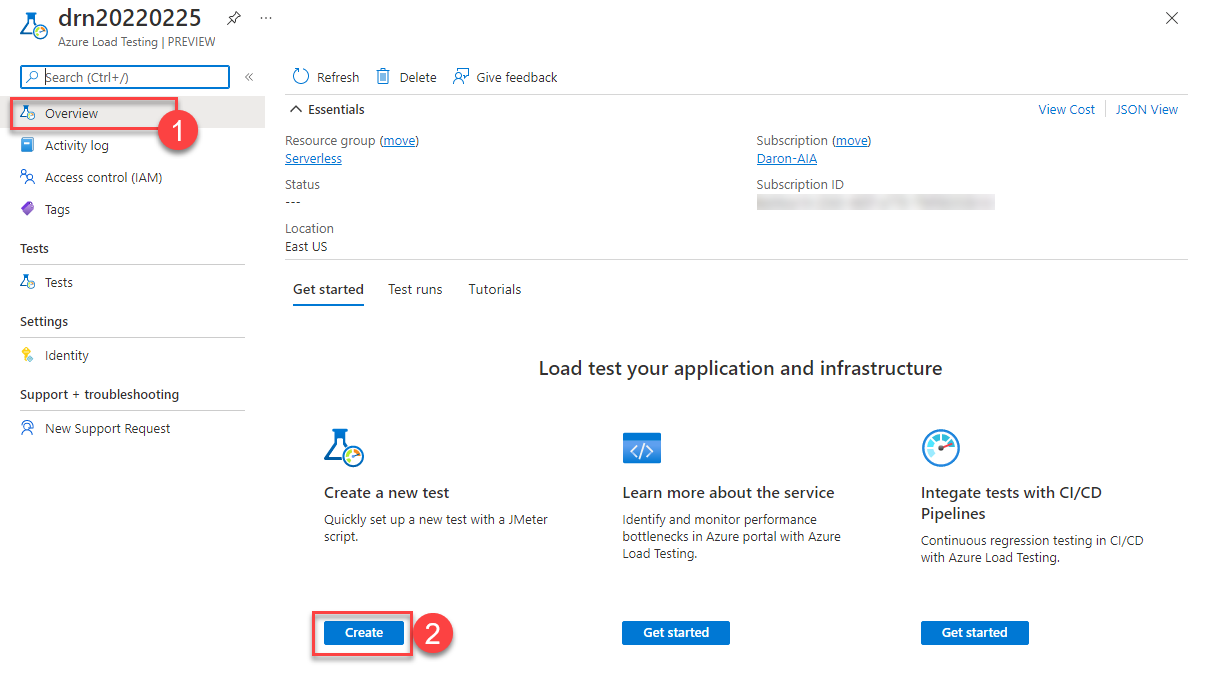
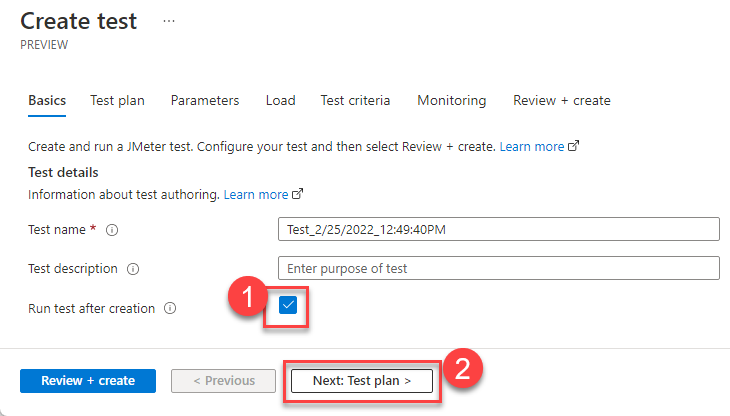
Make sure Run test after creation (1) is selected. Proceed with Next: Test plan > (2) button to upload our JMeter file.
Select your JMX file and upload (1). After the upload, your script will be validated and listed as part of the test plan (2). We will be using a single test execution engine instance with 200 threads for this test plan. You can change the number of test engines on the Load page in this wizard.
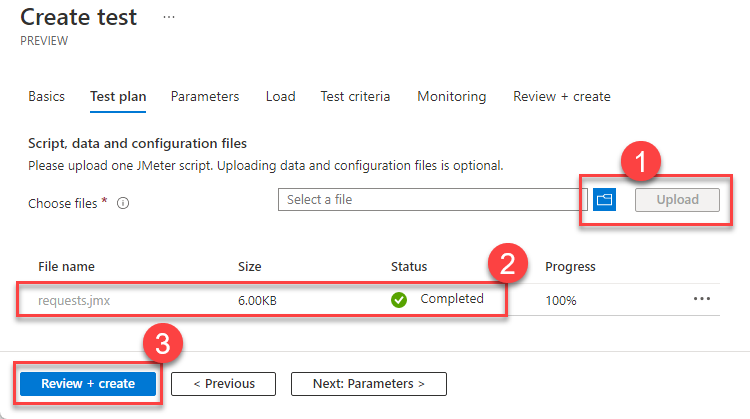
For now, we can select Review + create (3) to finish the process. Once the test is created, the first run will start. Below, you can see the test results while it is still executing. Remember, we have set the test to run forever, so we will have to Stop (5) it when we are done.
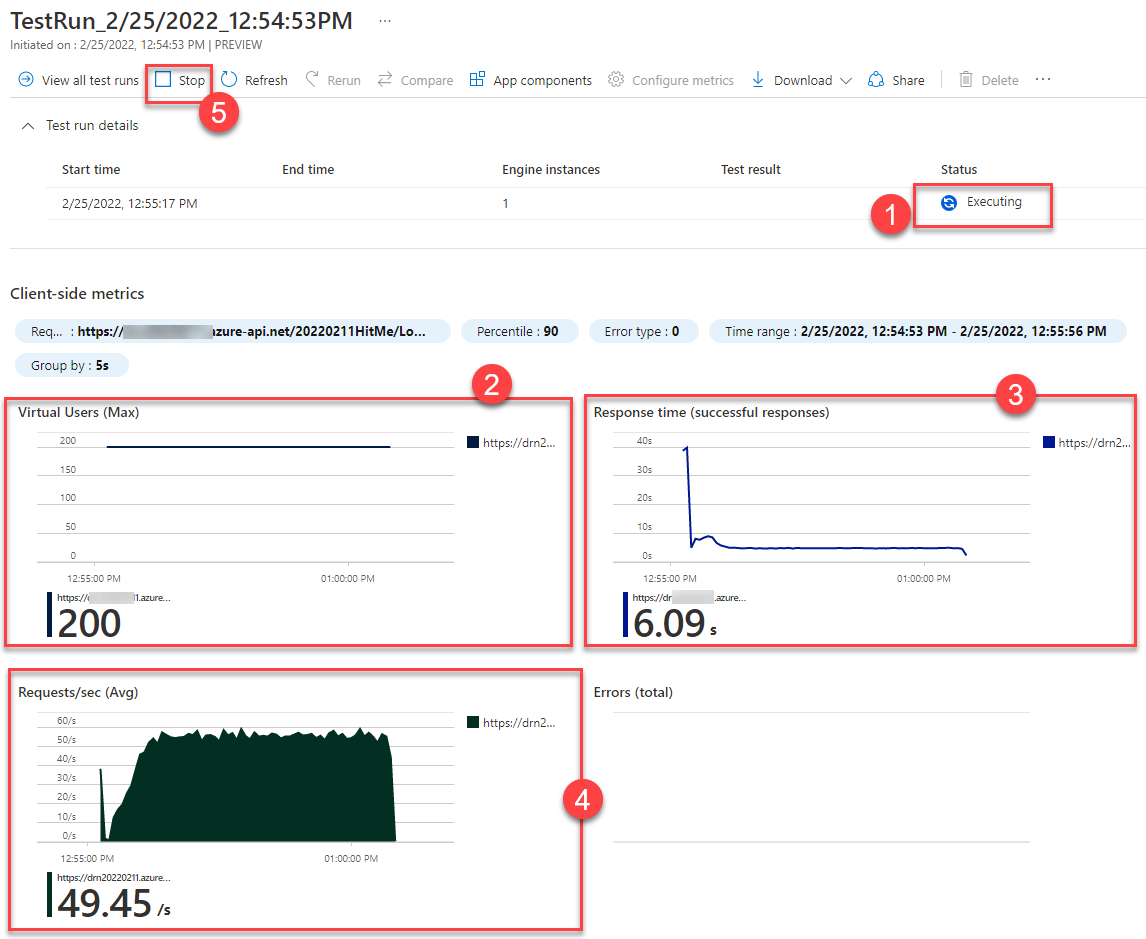
If you look at the numbers, you can see that we are hitting about 50 requests/sec on the API and the average response time is around 5 seconds. You might be wondering why 50 requests where we have 200 virtual users (threads). It is because these threads are being blocked for 5 seconds for each API call. In other terms, for an average 5 second wait time, 200 virtual users can only send 50 requests per second. If we want to increase the load, we must add more threads and test engine instances.
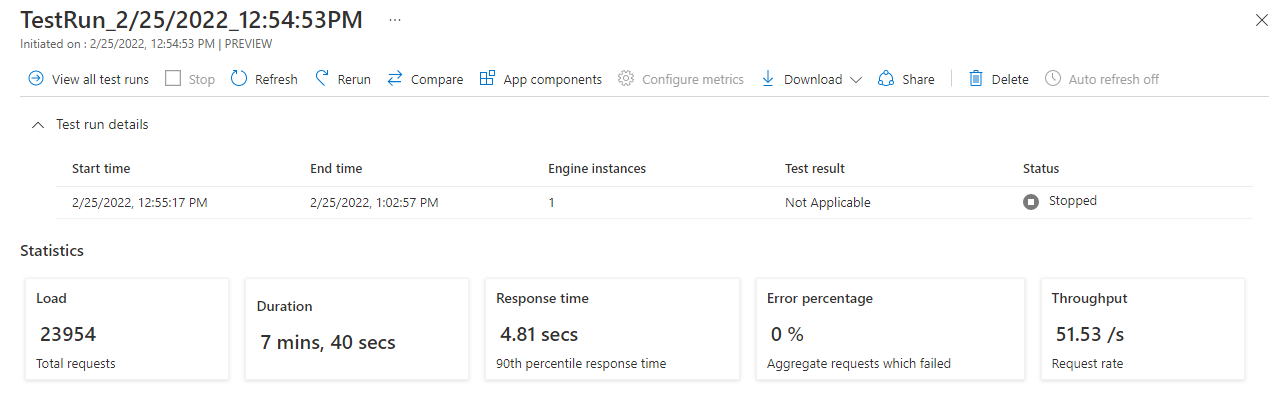
Above are the final results of our load test. If your design requirement is 50 RPS (request per second), this test tells us we hit that with 0 errors. Good one!
Resources
Daron Yondem advises senior technology leaders on AI-driven organizational transformation. Learn more →